
I’ve been a bit distracted by the outside world, as you all can imagine. I have to say I feel like Northern Italy has been going through the Corona Virus cycle for weeks now (my kids have been out of school since late February), and now we are 8 days into full blown lockdown. In fact, just a few minutes ago I heard a vehicle driving by announcing all residents need to stay inside save for justified reasons for leaving their property, namely: food shopping, medicines from local pharmacy, and/or work. It was first announced in Italian then English (which I appreciated), but what struck me was the English voice sounded exactly like Jamie Lee Curtis at the beginning of Escape from New York when she is setting up the dystopian scenario for that amazing film:
Bizarre, the feeling of living in a movie has never been more powerful than over the last week or so here in Trento. With more than a week into lockdown I am finding ds106radio a real savior right now—so thanks for that folks!
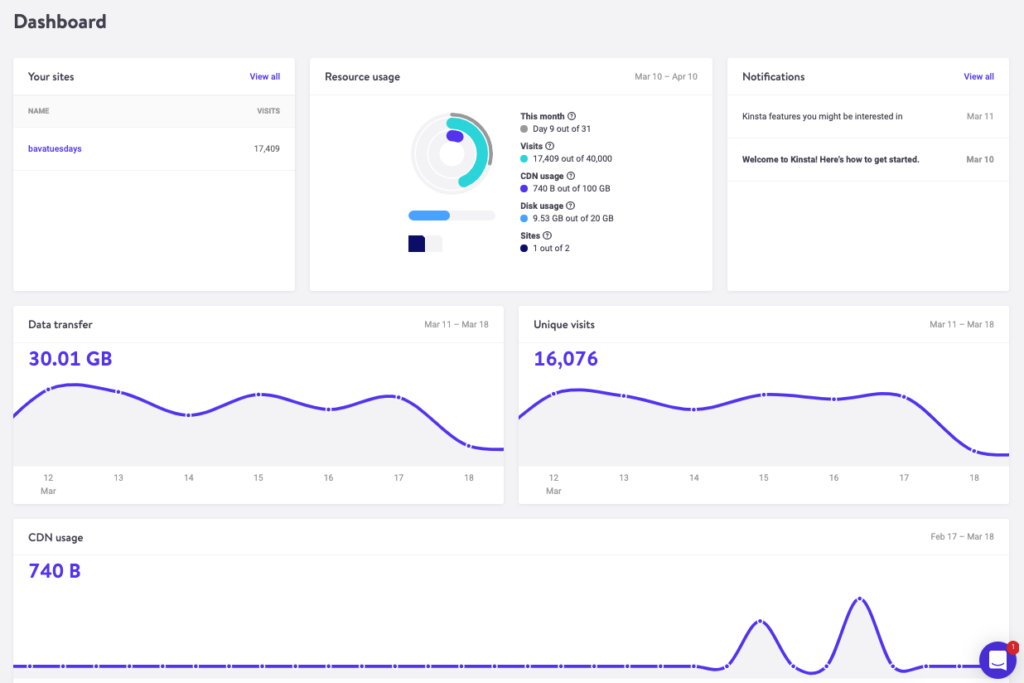
Another thing I have been doing to distract myself has been playing around with hosting alternatives for bavatuesdays. I have the site on Kinsta right now, and one thing that has struck me is while I’m aware my site has fallen off a traffic cliff since the heady days of EDUPUNK,* Kinsta has me clocked at around 2,500 unique visits a day. This is a big delta from what I thought (100-200 daily at most), this is especially important given I am paying Kinsta by the visit. I was sure the $30 plan (which allows 20,000 visitors per month) would be more than enough, but not even 10 days in I’m almost at my monthly limit. For the time being I bumped the plan to 40,000 visits as I try and figure out what’s up.
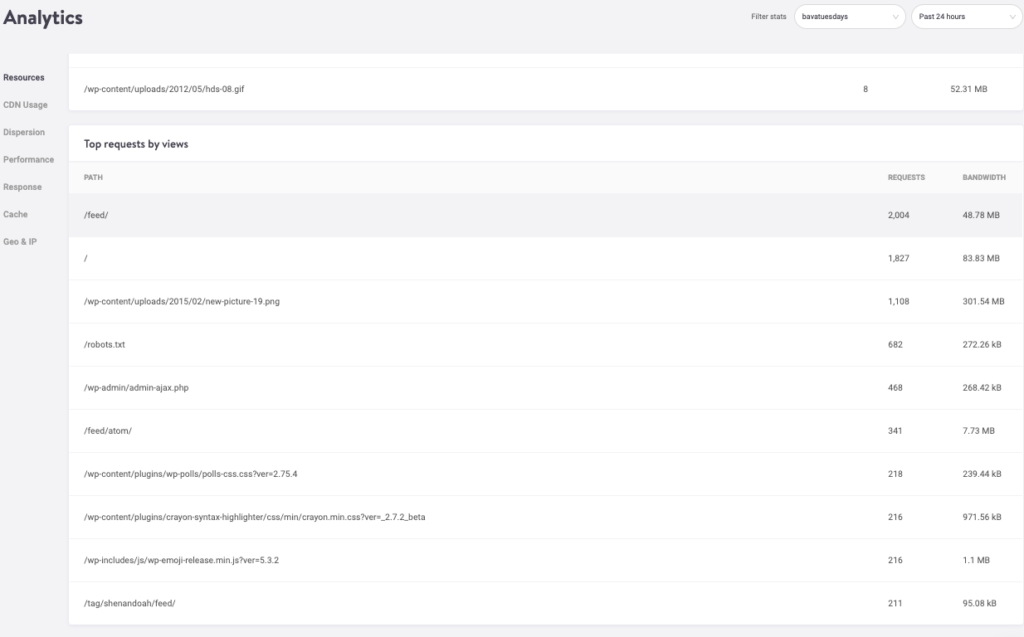 I never know if I’m reading this right, but 2,004 requests via /feed suggest there are quite a few RSS readers that wordpress.com and Google Analytics do not account for? Not sure that’s right though, sounds very high to me. Especially when the main site is suggesting 1,827 hits additionally. Anyway, I can’t really make sense of Kinsta’s analytics in terms of visitors and hits which is concerning given I am paying by the visitor. The other thing that may be at work here is that a few of my GIFs must be on some fairly popular page, and I am wondering if they are hot linking the images which is driving high bandwidth and also possibly counting as visits? Not sure, but what I do know is that the following 5 (and one for good luck) are the top bandwidth eating GIFs being viewed on bavatuesdays at the moment, and the selection makes me pretty happy!
Apoclaypse Now hi-res is #1 by a long shot given–I thinks it’s 20 MBs 🙂

Number 2 is a 4 GIF series from the Chinese film Ju Dou that was created by a student at UMW as part of GIF film analysis for Sue Fernsebner‘s Chinese Cinema course.


Number 3 is the cat from Alien, which I made—which makes me happy!

And another bava special is this one featuring the C.H.U.D. sewer, it is almost like the GIF breathes with the smoke coming through the holes.

And rounding out the top 5 is this gem from Road Warrior, which invokes the good old days of edtech survivalism 🙂

And honorable mention is this goodie, which is how I am feeling about pay-per-view hosting right now:

I want to try and setup a failover from Kinsta back to Digital Ocean, which at this point is becoming significantly cheaper than Kinsta. There’s a bit more work involved, but monthly it will be roughly $60 to $70 cheaper given based on Kinsta’s analytics I would need to pay $100 per month versus the $60 I just bumped to in order to avoid the overages—which amount to $1 per 1000 visits, so if I went 40,000 visits over that would be $40 more than the $30 I paid monthly, which at this rate would be my situation. Before I move back to Digital Ocean though, I want to see if offloading all my media to Amazon’s S3 or Digital Ocean’s Spaces makes a significant difference in terms of visits and/or bandwidth demands.
Also, I am noticing while I am trying to use Kinsta’s CDN, it is not seeming to take effect in any significant way given there are only bytes of media being duplicated and served from elsewhere. Anyway, gonna give myself a week or so to try and replicate from Kinsta to Digital Ocean as well as figure out offloading media. Just another to-do brick in the Lockdown Wall!
*I average between 100-200 unique users a day according to both Google Analytics and WP.com stats.

If you ever make your way back to cPanel hosting, there’s a ‘hotlink protection’ section under Security that allows you to prevent other websites from directly linking to files on your site. So you could say disable the link back to all gifs, for instance, and then redirect the request to an external URL. Then again, based off this post, I’m not entirely sure you want to do that either. 🙂
I’d be curious to know if Kinsta has a similar hotlink protection tool?
Lauren,
Can’t see anything similar in Kinsta’s tools, and interestingly enough they are not so concerned with bandwidth usage as they are with traffic, and according to Stephen’s comment below, a lot of this is most likely cruft of bots and the like, so fake traffic hat I would need a tool like Bitninja’s WAF to block. Yet another rabbit hole to fall down 🙂
Here is how the define visitors: https://kinsta.com/knowledgebase/count-visits/#comparing-kinsta-visitor-counts
I know you’re popular, but that seems high. It looks to me like it’s counting hits, not visits, and including search engine and other cruft traffic (how else to explain the listing ‘requests’ to robots.txt and .css).
By contrast, according to awstats, I’m getting roughly 1.2K unique per day, 5K pages, 13K hits. That’s historically down (in my heyday I was getting 3K uniques per day). My ‘not viewed traffic’ (search engines, etc) is 20K pages, 30K hits per day, roughly.
Stephen,
It is interesting that in 2017 Kinsta moved from charging for bandwidth to just charging for visit. It looks like I have a ton of bandwidth usage but they are not concerned about that too much. Reading up more, they talk about this here:
https://kinsta.com/knowledgebase/count-visits/#comparing-kinsta-visitor-counts
The part where they are blocking bot traffic as a courtesy is interesting, but it appears I am either getting a ton from folks using ad blockers or I need to setup a WAF (like Bitninja) to control bot traffic. They talk about this here:
https://kinsta.com/knowledgebase/count-visits/#comparing-kinsta-visitor-counts
But at the end of he day being charged for bot traffic bandwidth can get expensive quick, and it appears given how long downes.ca has been up and running and how much traffic you number seem low. Are you blocking bots? Anything you are dong to manage that? One of the things we have been weighing at Reclaim as we consider container-based hosting is alternative models for calculating costs, and this opens up a pretty slippery slope for trying to quantify traffic and value.
Thanks for the comment and the stats, it was really useul.
I’m not using anything specific to block bots other than a robots.txt file.